Compare Groups
Comparing Leave and Remain Supporters
Our final intial question was making an inital broad comparison between the views of Leave and Remain supporters.
We can achieve this with a Matrix Coding Query combining our interview transcript autocoding with our People case classification attribute values.
Matrix Coding Query
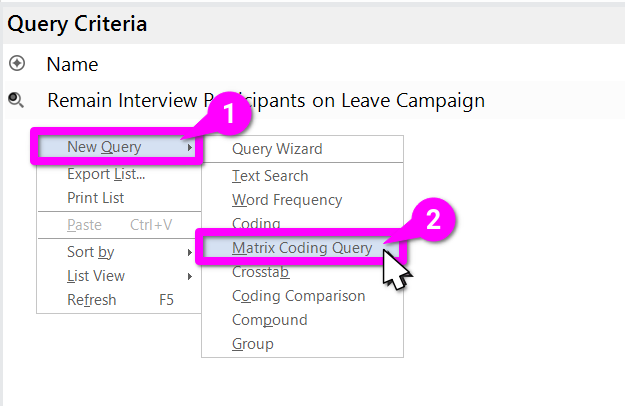
Within the Query Criteria, right-click in the white space and -
- Select ‘New Query’
- Then ‘Matrix Coding Query’
This will open a new tab for creating a Matrix Coding Query. We can see some of the familar elements again. In yellow we have the optiosn for searching across all Files & Externals or specific Items and Folders. In blue, we have the default ‘And’ for handling criteria - other options include Or, Not, and Near. What is different though is rather than adding 1+ criteria, we have a box for selecting Rows and another for Columns, in red.
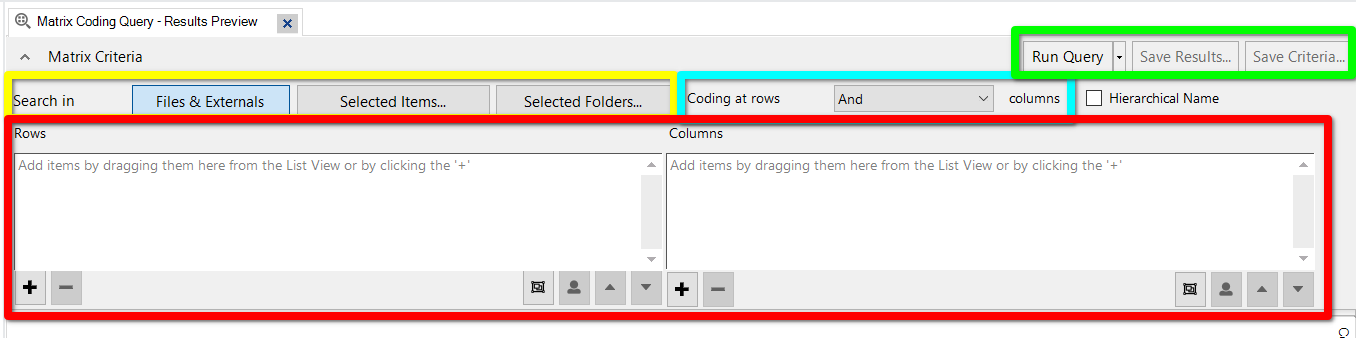
Adding Rows
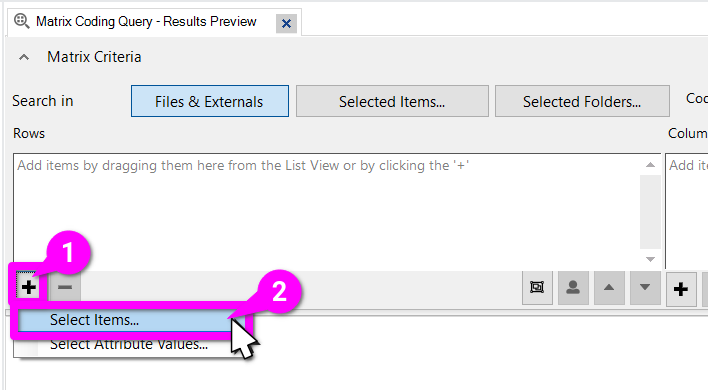
It is possible to drag and drop items into the boxes for Rows and Columns, but it is often far quicker and more convenient to use the ‘Select Project Items’ dialogue.
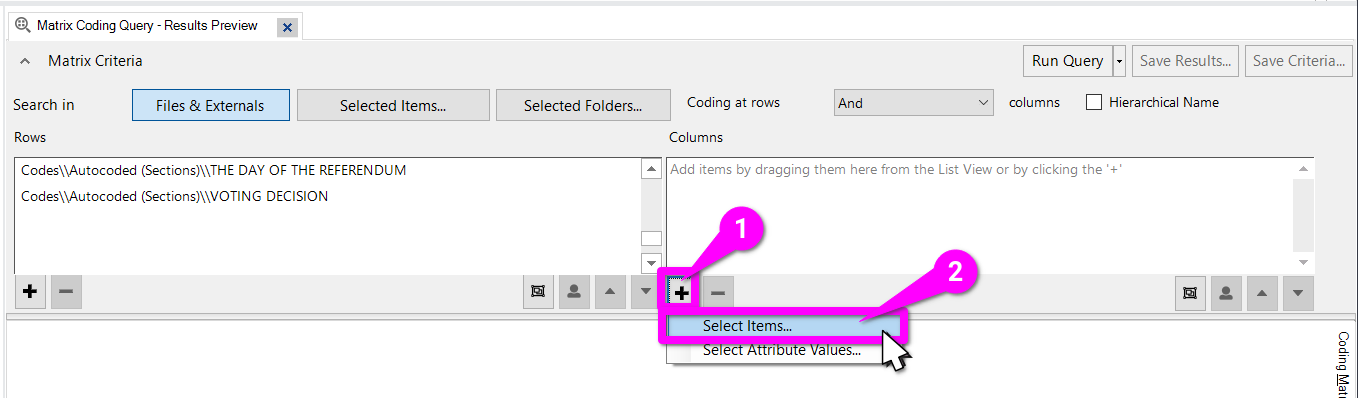
- Click the ‘+’ underneath the Rows box on the left.
- From the two options click ‘Select Items…’
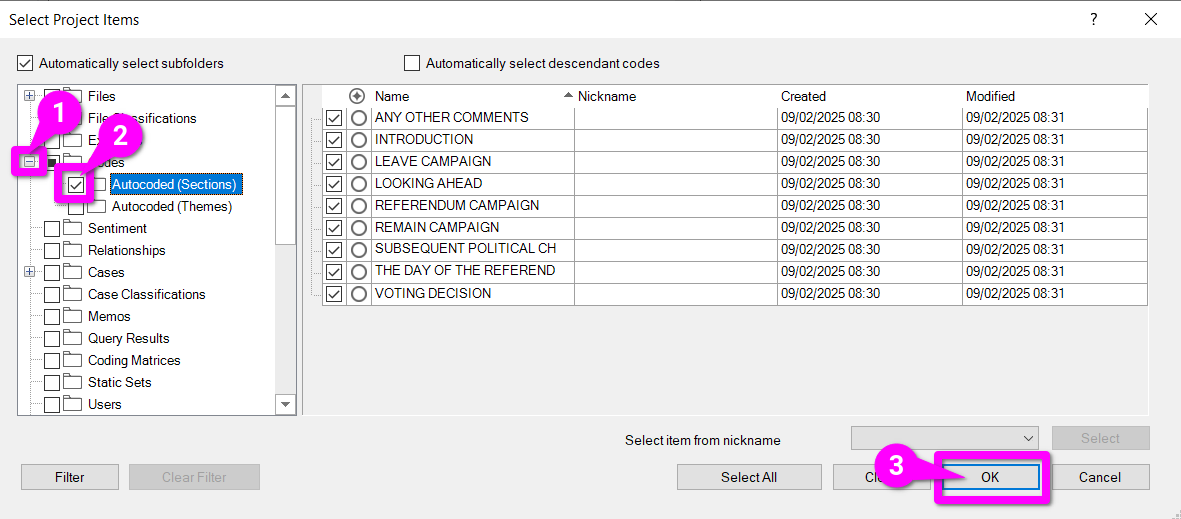
Then within the Select Project Items dialogue:
- Expand the Codes folder.
- Check the tickbox for the ‘Autocoded (Sections)’ sub-folder.
- Hit ‘OK’.
Adding Columns
We can follow the same process to select our columns.
- Click the ‘+’ underneath the Columns box.
- From the two options click ‘Select Items…’
Whilst ‘Select Attribute Values..’ is an option, that is for selecting individual values with criteria (equals, does not equal) one by one. For our purposes, ‘Select Items…’ remains more convenient.
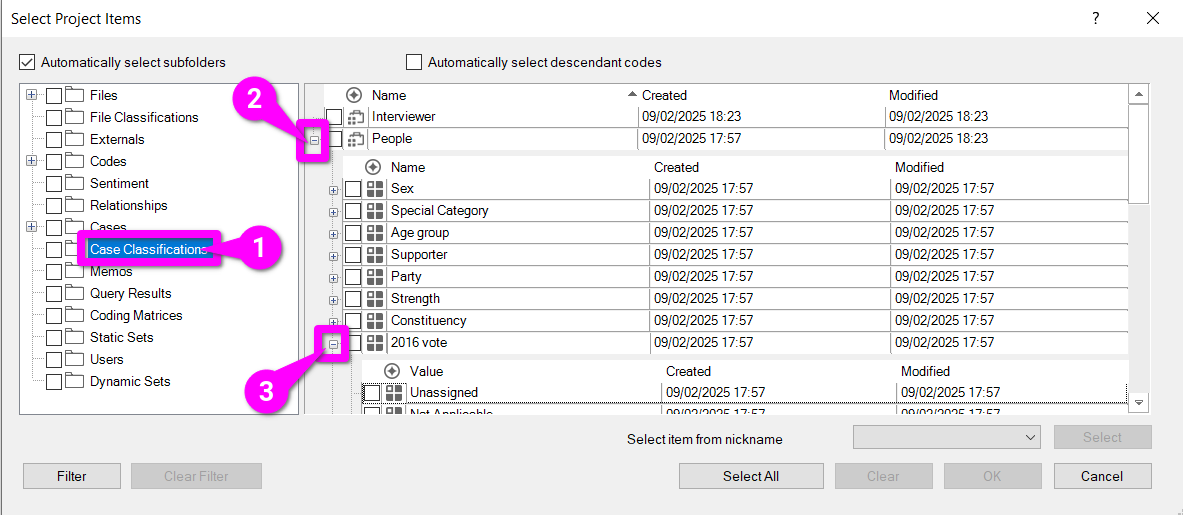
- Select the ‘Case Classifications’ folder.
- Expand the ‘People’ case classification.
- Expand the ‘2016 vote’ attribute.
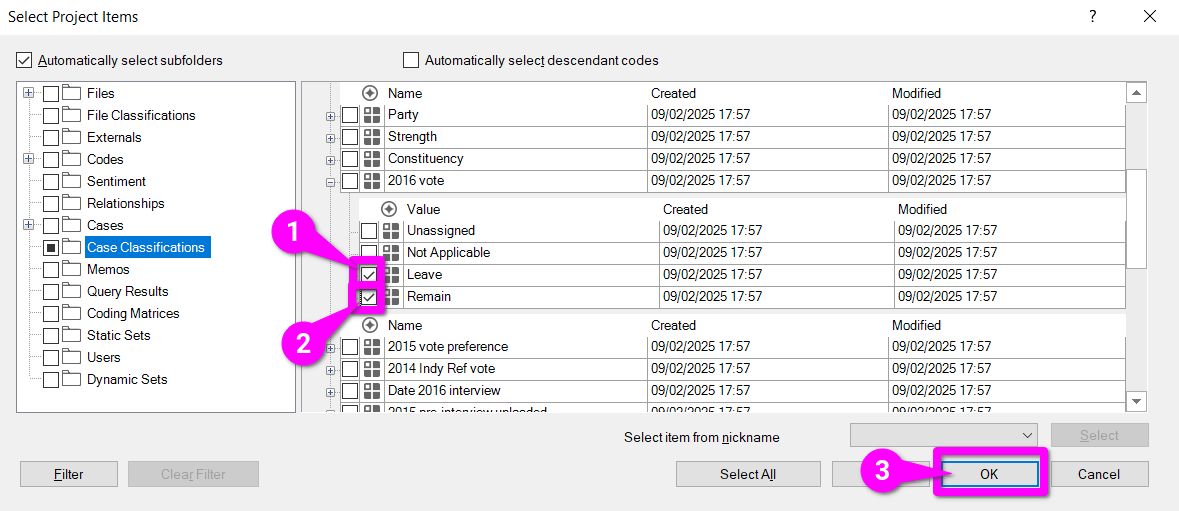
After scrolling down a bit:
- Check the box for ‘Leave’ attribute value.
- Check the box for ‘Remain’ attribute value.
- Hit ‘OK’.
Viewing Results
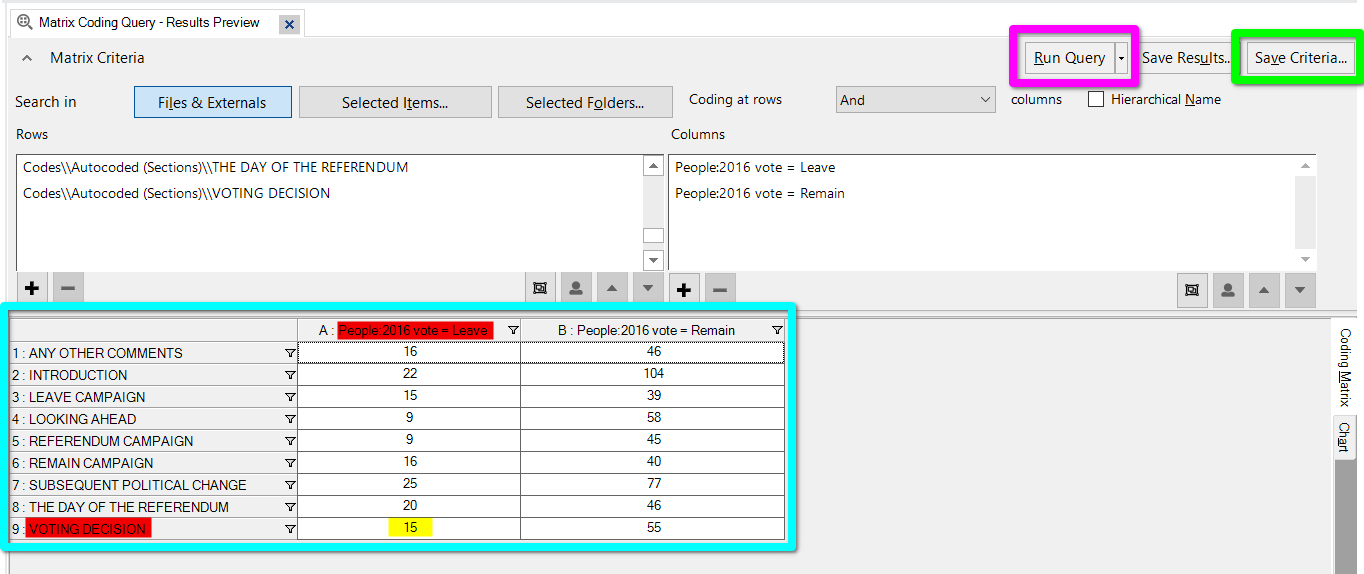
After selecting our Rows and Columns, we can hit ‘Run Query’ (in pink) to create our Coding Matrix. Remember if you want to be able to quickly re-run and update the Coding Matrix to also hit ‘Save Criteria…’ (in green) and give it a suitable name.
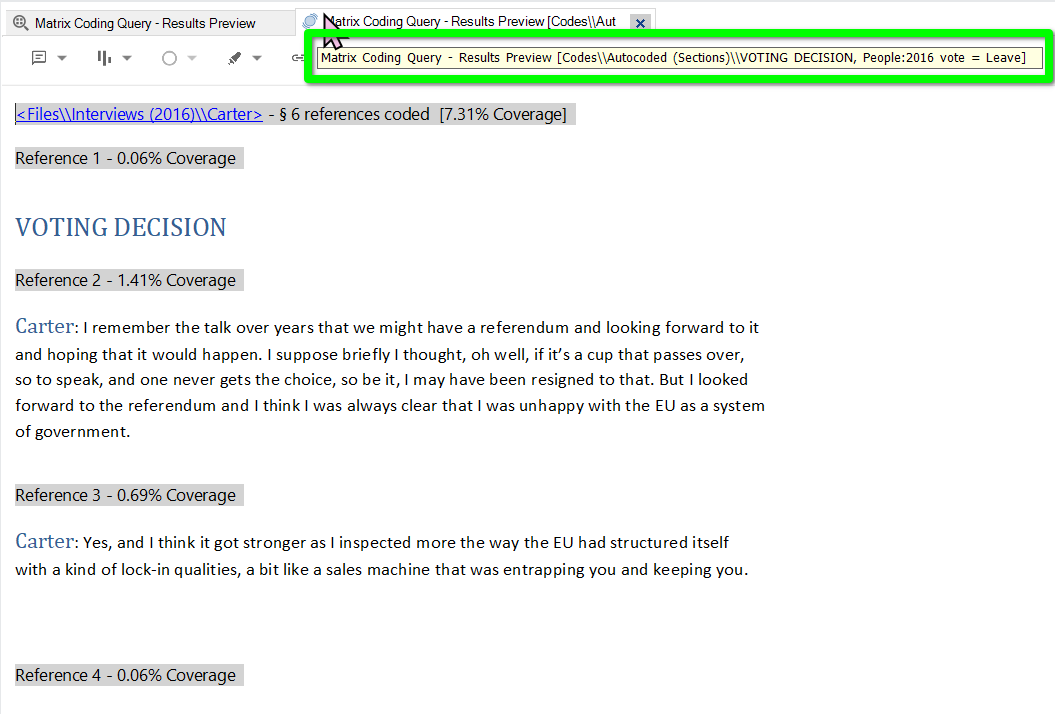
The Coding Matrix itself (in blue) for each cell in the table shows how many coded sections intersect the two. So, the cell highlight (in yellow) is telling us that 15 sections coded ‘VOTING DECISION’ were also coded to cases, where the participant the case is for supported Leave (both in red).
Viewing Cell Coding
That may not seem all that impressive at first. The real power of Coding Matrices though come from double-clicking any of the cells.
That will open a new tab showing all the coded sections being counted in that cell. So, for our example, it opens a tab showing all sections coded ‘VOTING DECISION’ AND also coded to a case where the participant supported Leave.
This makes a Coding Matrix the equivalent of a table of shortcuts to more specific queries. Since you can create them with classification attributes, it also makes them ideal for creating queries to aid comparison.